

With the recent heat waves and droughts, an unusually high number of virulent wildfires started in various places of the globe, including Central Africa, Western Canada, the South-West of the United States, and Italy. In this article, we will go over an often-used way to assess the damages caused by the recent series of wildfires through the differential in normalized burn-ratio.
LOOKING AT THE DIFFERENTIAL IN NORMALIZED BURN-RATIO (DNBR)
The Normalized Burn Ratio (NBR) highlights burned areas and help scientists estimate fire severity. The formula is similar to NDVI, except that it uses near-infrared (NIR) and shortwave-infrared (SWIR) wavelengths.
As with other indexes, NBR uses the different spectral signatures of the features we want highlighted to come up with a simple mathematical formula to apply to the digital values of the pixels to help better visualize said features. In this case, healthy vegetation has a high reflectance in the near-infrared portion of the spectrum, while offering low short-wave infrared reflectance. On the other hand, burned areas have a high shortwave infrared reflectance but low reflectance in the near infrared.
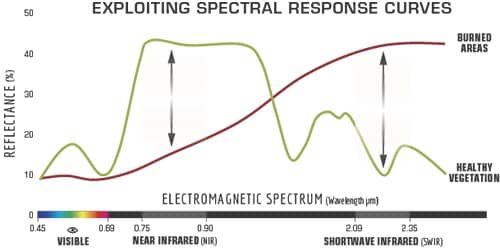
Using the NBR formula, high NBR values tend to indicate healthy vegetation while recently burned areas would display lower values.
The most commonly used formula for Normalized Burn Ratio is
NBR = (NIR-SWIR) / (NIR+SWIR)
Where NIR stands for near-infrared values and SWIR for short-wave infrared values.
However, for this specific application, we were able to obtain 2 different SWIR bands and use the following formula instead:
NBR2 = (SWIR1-SWIR2) / (SWIR1+SWIR2)
Where SWIR 1 are the digital values of the short-wave infrared 1 band and SWIR 2, the digital values of the short-wave infrared 2 band.
PRACTICAL APPLICATION: VESUVIUS
Using the recent Vesuvius wildfire as an example, let’s explore how to use dNBR to better visualize the impact of a wildfire.
Through SkyWatch EarthCache, we extracted two overlapping Landsat-8 products one month prior to the Vesuvius wildfire and one month after the fire. We chose Landsat-8 products because most commercial satellites do not have shortwave infrared (SWIR) bands. These are currently only available on NASA’s Landsat-8, ESA’s Sentinel-2, and Digital Globe’s WorldView-3. When looking at the different options, Landsat-8 returned great images for the area as the extent of the fire was large enough to be highly visible at a 30m resolution, which is why we chose it.
STEP 1: EXTRACTING THE DATA USING SKYWATCH EARTHCACHE API
We needed to find two good images of the area, with low cloud cover, in relatively close time-proximity to the fire, one before, and one after, to get an accurate representation of the changes brought by the fires.
SkyWatch EarthCache pipelines return Earth observation data matching pre-configured parameters that was collected during a specified date range. However, in this case, we were looking for data outside of a date range, the time of the fire. In order to find what we were looking for, we simply set up two pipelines. You can more information on how to set a pipeline for Earth observation data here [link to KB article].
From the pipelines, we retrieved the NIR, SWIR1, and SWIR2 bands. Once that step was completed, we applied Top of Atmosphere atmospheric correction and coregistered the images into a stack.
STEP 2: TOP-OF-ATMOSPHERE (TOA) ATMOSPHERIC CORRECTION
The radiance measured by satellites can be different from the radiance measured at the surface since light reflected from the ground has to travel through the atmosphere and is partially scattered by atmospheric aerosols before reaching the sensors. A similar scattering effect can be observed when looking at a landscape very far away, on a hazy day.
Top-of-Atmosphere atmospheric correction is a way to transform top-of-atmosphere measurements into a more accurate reflection of surface reflectance. Visually, it translates into clearer looking imagery and studies have shown it improves the accuracy of results when looking at data collected at different times and different places. Most satellites data providers offer easy ways to do TOA atmospheric corrections.
In this specific instance, to convert the digital numbers into reflectance values, we used the following formula:
ToA corrected values = (Band-specific multiplicative rescaling factor * digital numbers) + Band-specific additive rescaling factor
For Landsat-8 data, both the multiplicative rescaling factor and the additive rescaling factor for each band can be found in the metadata file, under REFLECTANCE_MULT_BAND_x + REFLECTANCE _ADD_BAND_x respectively (where x is the band number for that specific band)
Once both images, pre-fire and post-fire were corrected, we coregistered them into a stack.
STEP 3: CO-REGISTERING THE IMAGES
Simply overlaying the images based on their geolocation is not always enough to line them up pixel to pixel. In order to do line both images, we used a cross-correlation based coregistration offered by the Sentinel Application Platform (SNAP).
The coregistration determines how much the pixels of one image have shifted compared to the other image and warps the shifted image into the coordinate space of the other. Cross-correlation is the mathematical formula used to calculate the exact spatial shift between the two images.
If you are not familiar with SNAP, you can download the most recent version of the toolbox from the ESA website.
STEP 4: CALCULATING THE NORMALIZED BURN RATIO
We then applied the differential normalized burn ratio (dNBR). The dNBR is calculated simply by comparing the NBR pre-fire and the NBR post-fire.
For this specific application, we found formula using both SWIR bands displayed the burn scars more prominently.
dNBR = NBRprefire – NBRpostfire
where NBR is
NBR= (SWIR1-SWIR2) / (SWIR1+SWIR2)
STEP 5: COLOURS!
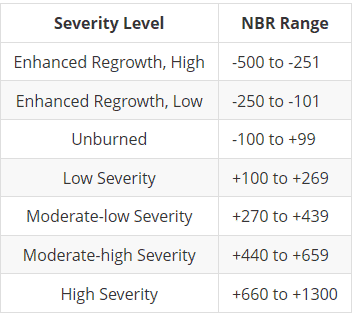
As a last step, we colour coded the final product to visually display the burn area and the severity of the damage to vegetation. In 6 short and easy steps, we were able to obtain a very visual representation of the extent of the burned vegetation on the side of Mt Vesuvius following the wildfires.
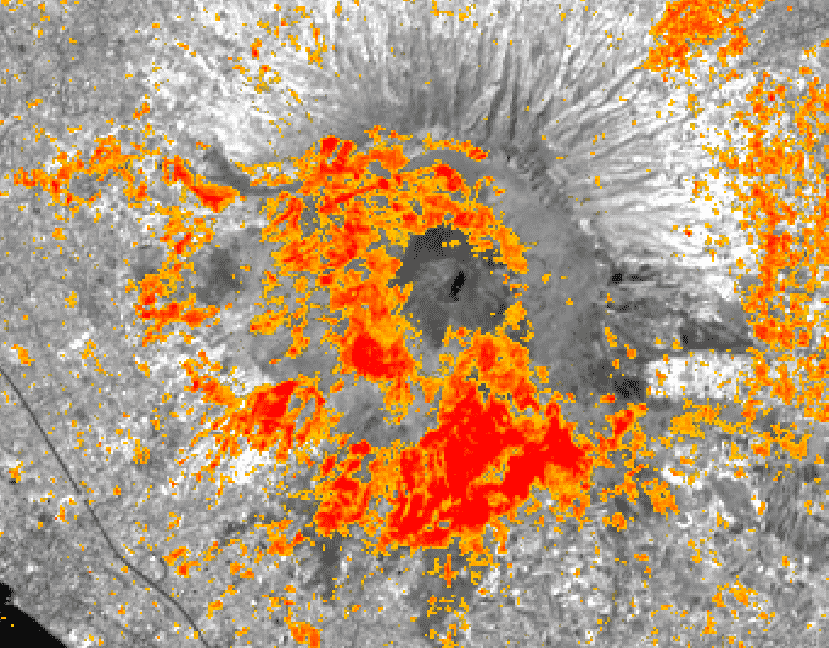
A colourized satellite image showing the burn scars on the side of Mount Vesuvius after the 2017 wildfires. Burn scars are in orange and red
in the above image.
The fires were extremely severe on the South side of the volcano, destroying large areas of vegetation and even extending to the residential areas nearby, forcing citizens to flee. Luckily no damage or fatalities were reported. In all, about 18 square kilometers (7 square miles) were affected by the wildfires.
The fires have since been contained but the damage could extend much further. The volcano is composed of alternating layers of hard lava and loose volcanic ash. Many of trees anchoring the top layer of ground burnt, rendering the slopes particularly vulnerable to mudflows during heavy rainfall.
According to David Bressan, “Many streets leading to the volcano were built crossing former erosion channels, characterizing all the slopes of the mountain. If a mudflow forms, it could rush down these channels, posing a risk to the streets. Postfire debris flows are documented from many areas affected by wildfires and periodic storms. Fire not only destroys the vegetation cover but also damages the ground and loosens debris, like large rocks, chunks of soil and dead trees. During heavy rain, this rubble will be washed down the slope and channelized will form a dangerous debris flow. Following the old channels, this material poses a risk also to the nearby residential areas. Depending on the effective damage, to be verified now in the field, the risk of debris flow could last as long as three years until new trees grow enough to stabilize the slopes of Vesuvius.“
This is why it is now critical for the local authorities to actively monitor the regrowth of trees in the area, and, as with dangerous to access areas or large swath of lands, Earth observation technologies can be a cost- and time-effective substitute or supplement to field-based monitoring.